Overview of Azure Data Factory User Interface

In the previous post, we started by creating an Azure Data Factory, then we navigated to it. In this post, we will navigate inside the Azure Data Factory. Let’s look at the Azure Data Factory user interface and the four Azure Data Factory pages.
Azure Data Factory Pages
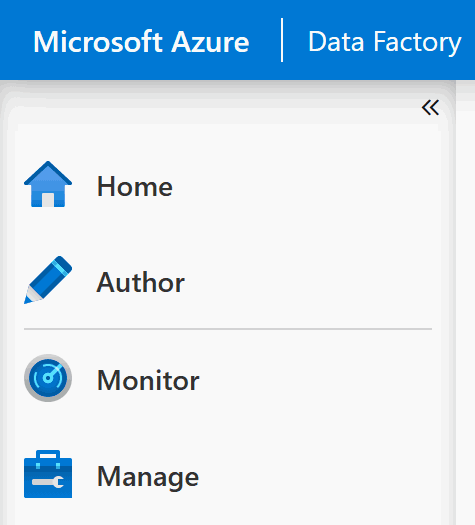
On the left side of the screen, you will see the main navigation menu. Click on the arrows to expand and collapse the menu:
Once we expand the navigation menu, we see that Azure Data Factory consists of four main pages: Home, Author, Monitor, and Manage:
Home Page
The Home page is your dashboard. From here, you can do some of the most common tasks:
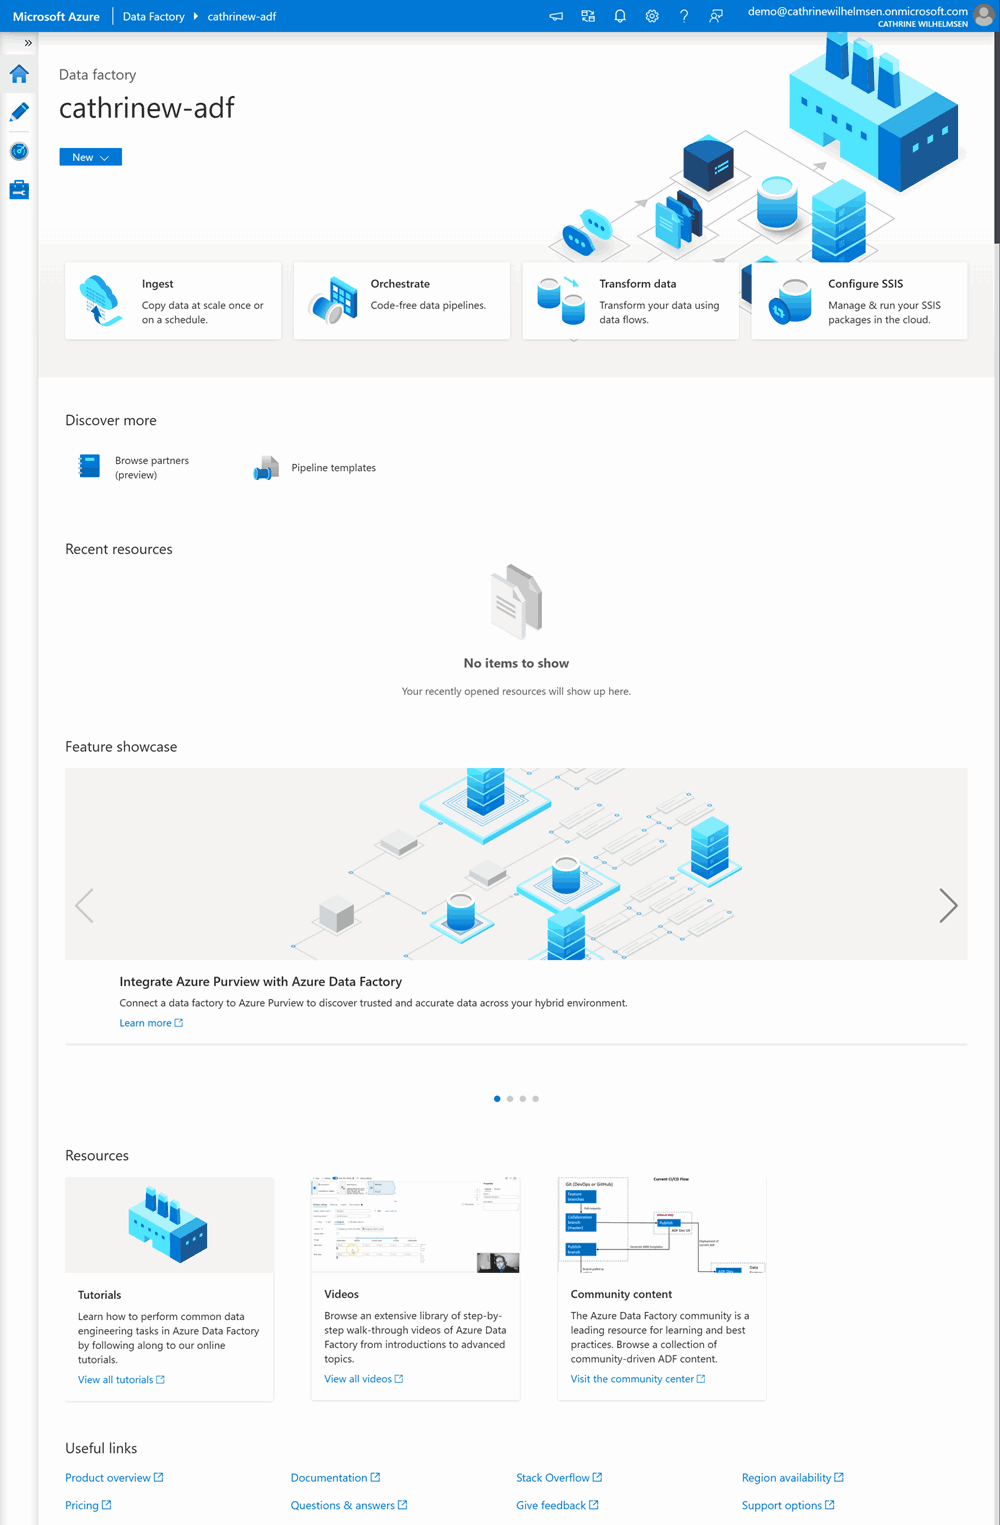
You can also read Azure Data Factory tutorials, view Azure Data Factory videos, and find links to more resources.
Author Page
The Author page is your main development environment:
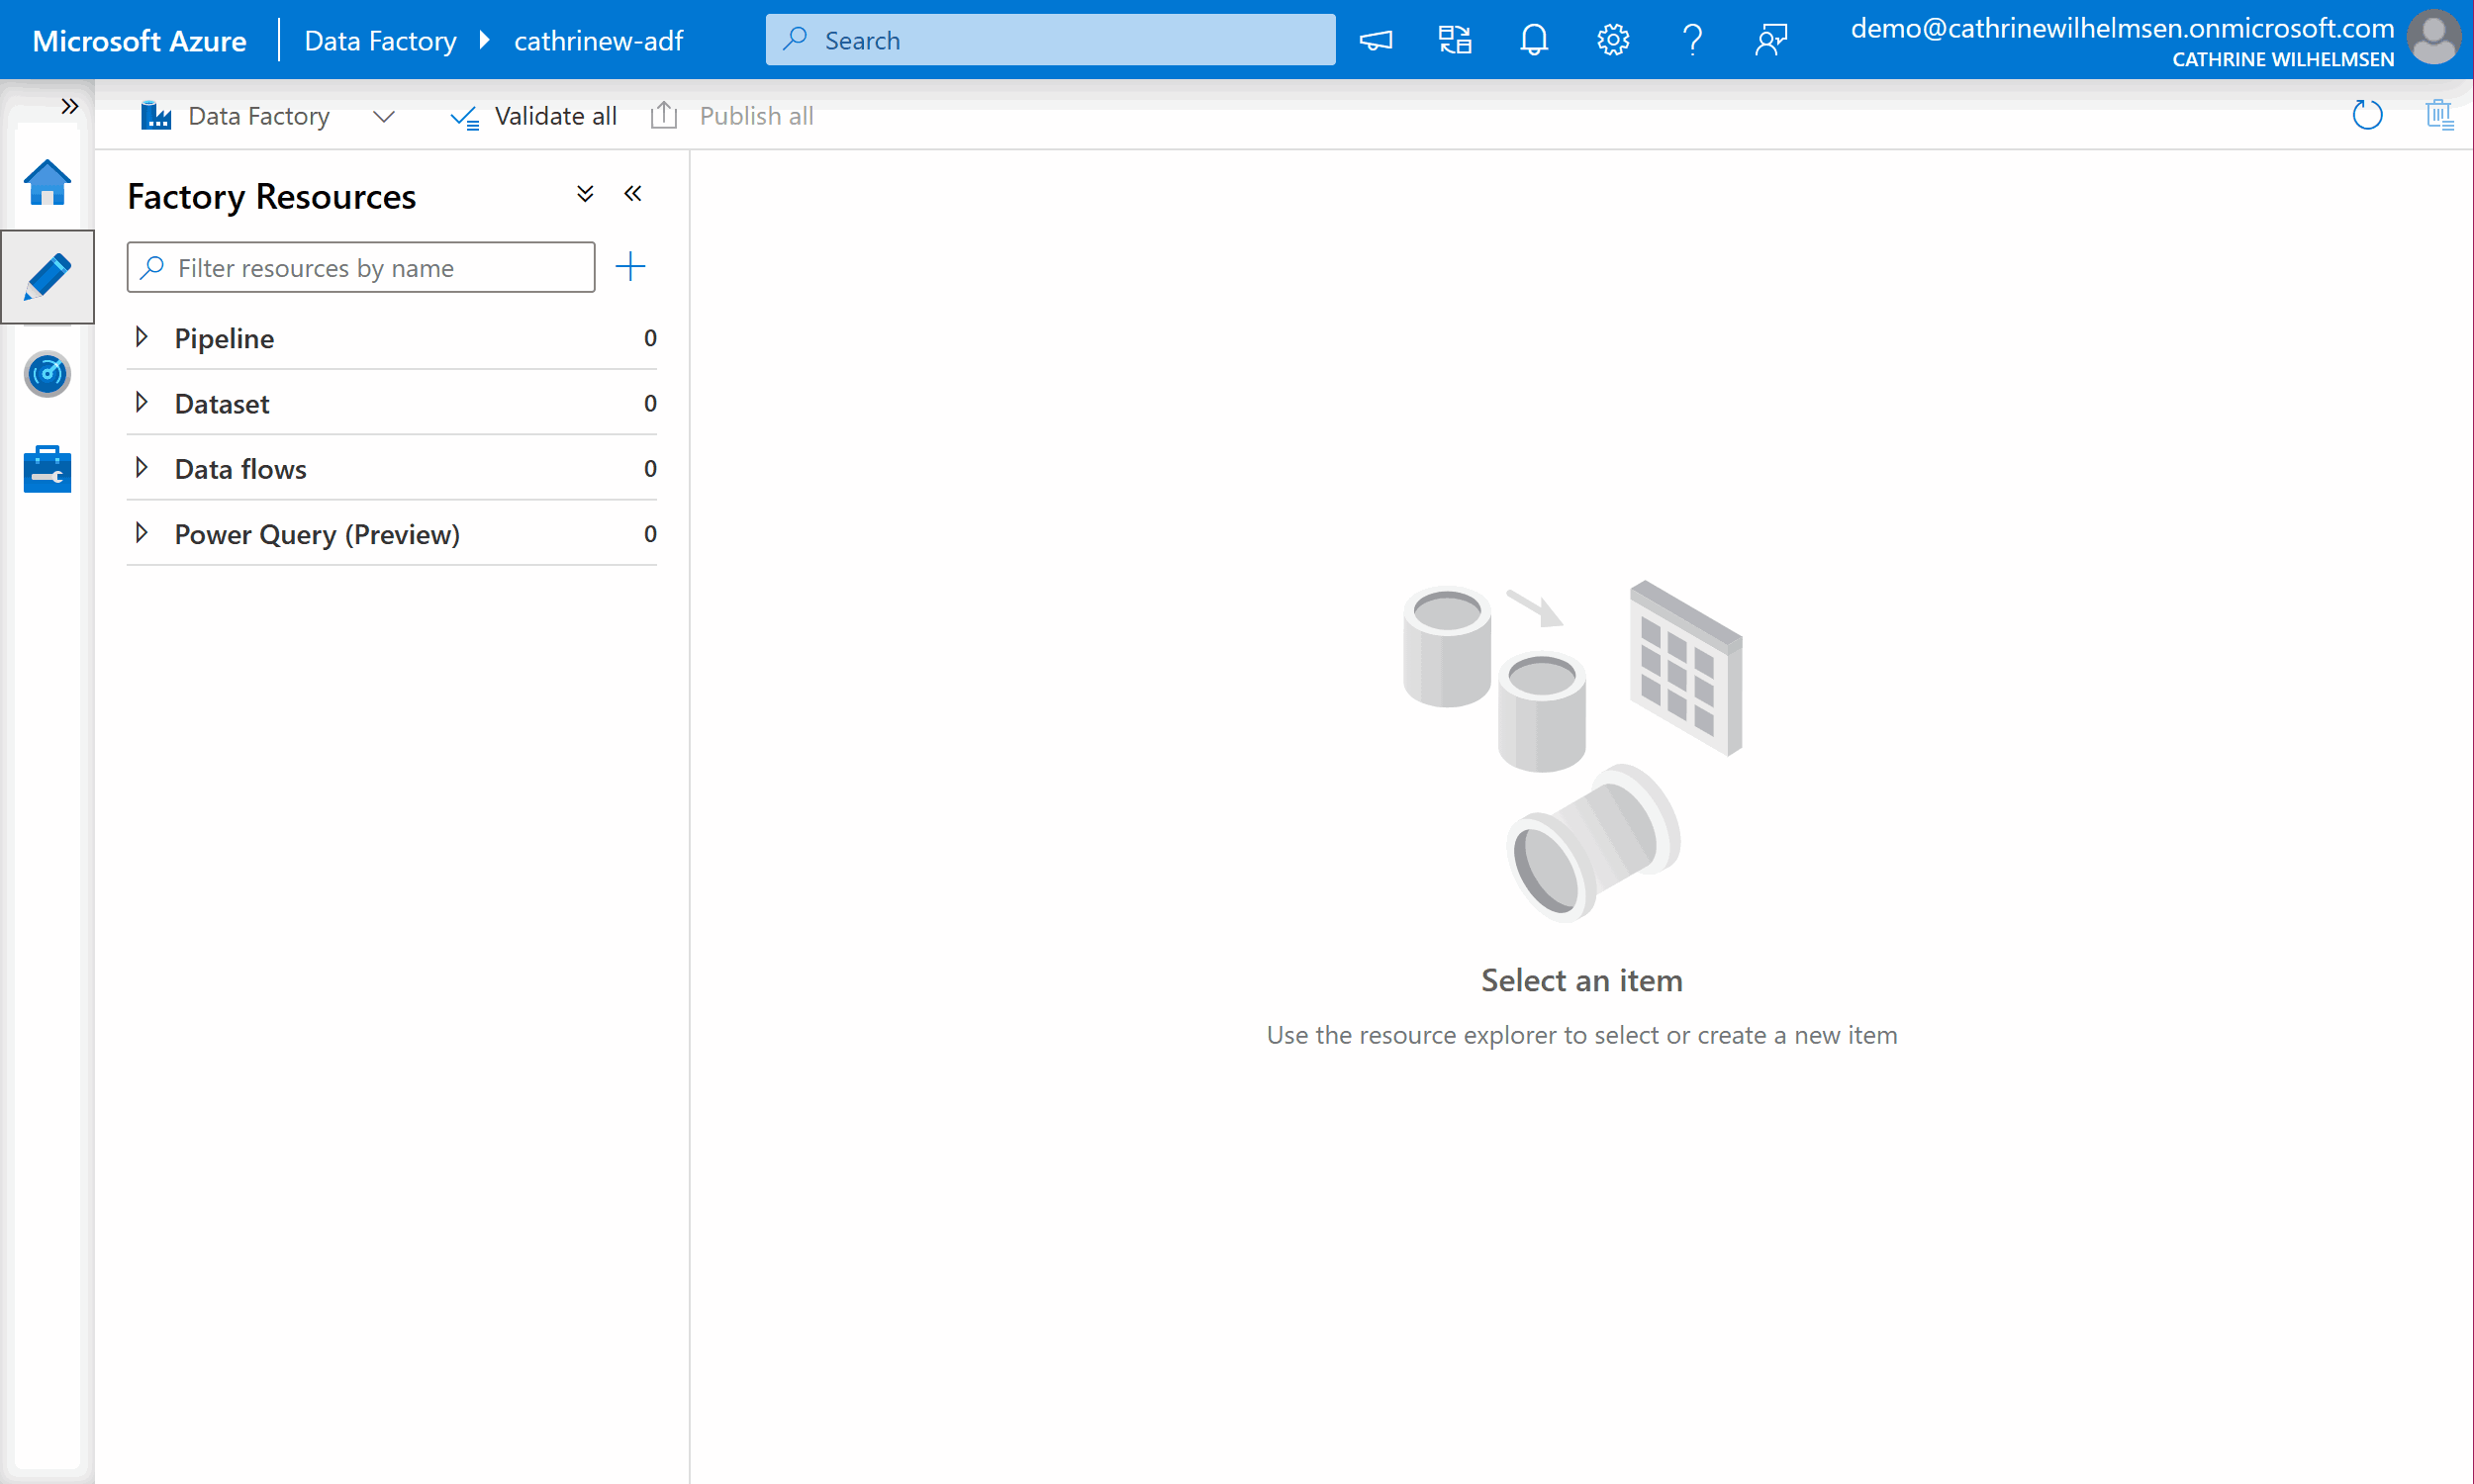
This is where you will be spending most of your time during development. On the left side, you will see all your factory resources. (After we create some factory resources, that is. We’ll get back to that soon!) You also have a search bar at the very top of this page. From there, you can search for all your factory resources.
Monitor Page
The Monitor page is where you can… uh… monitor stuff 😂:
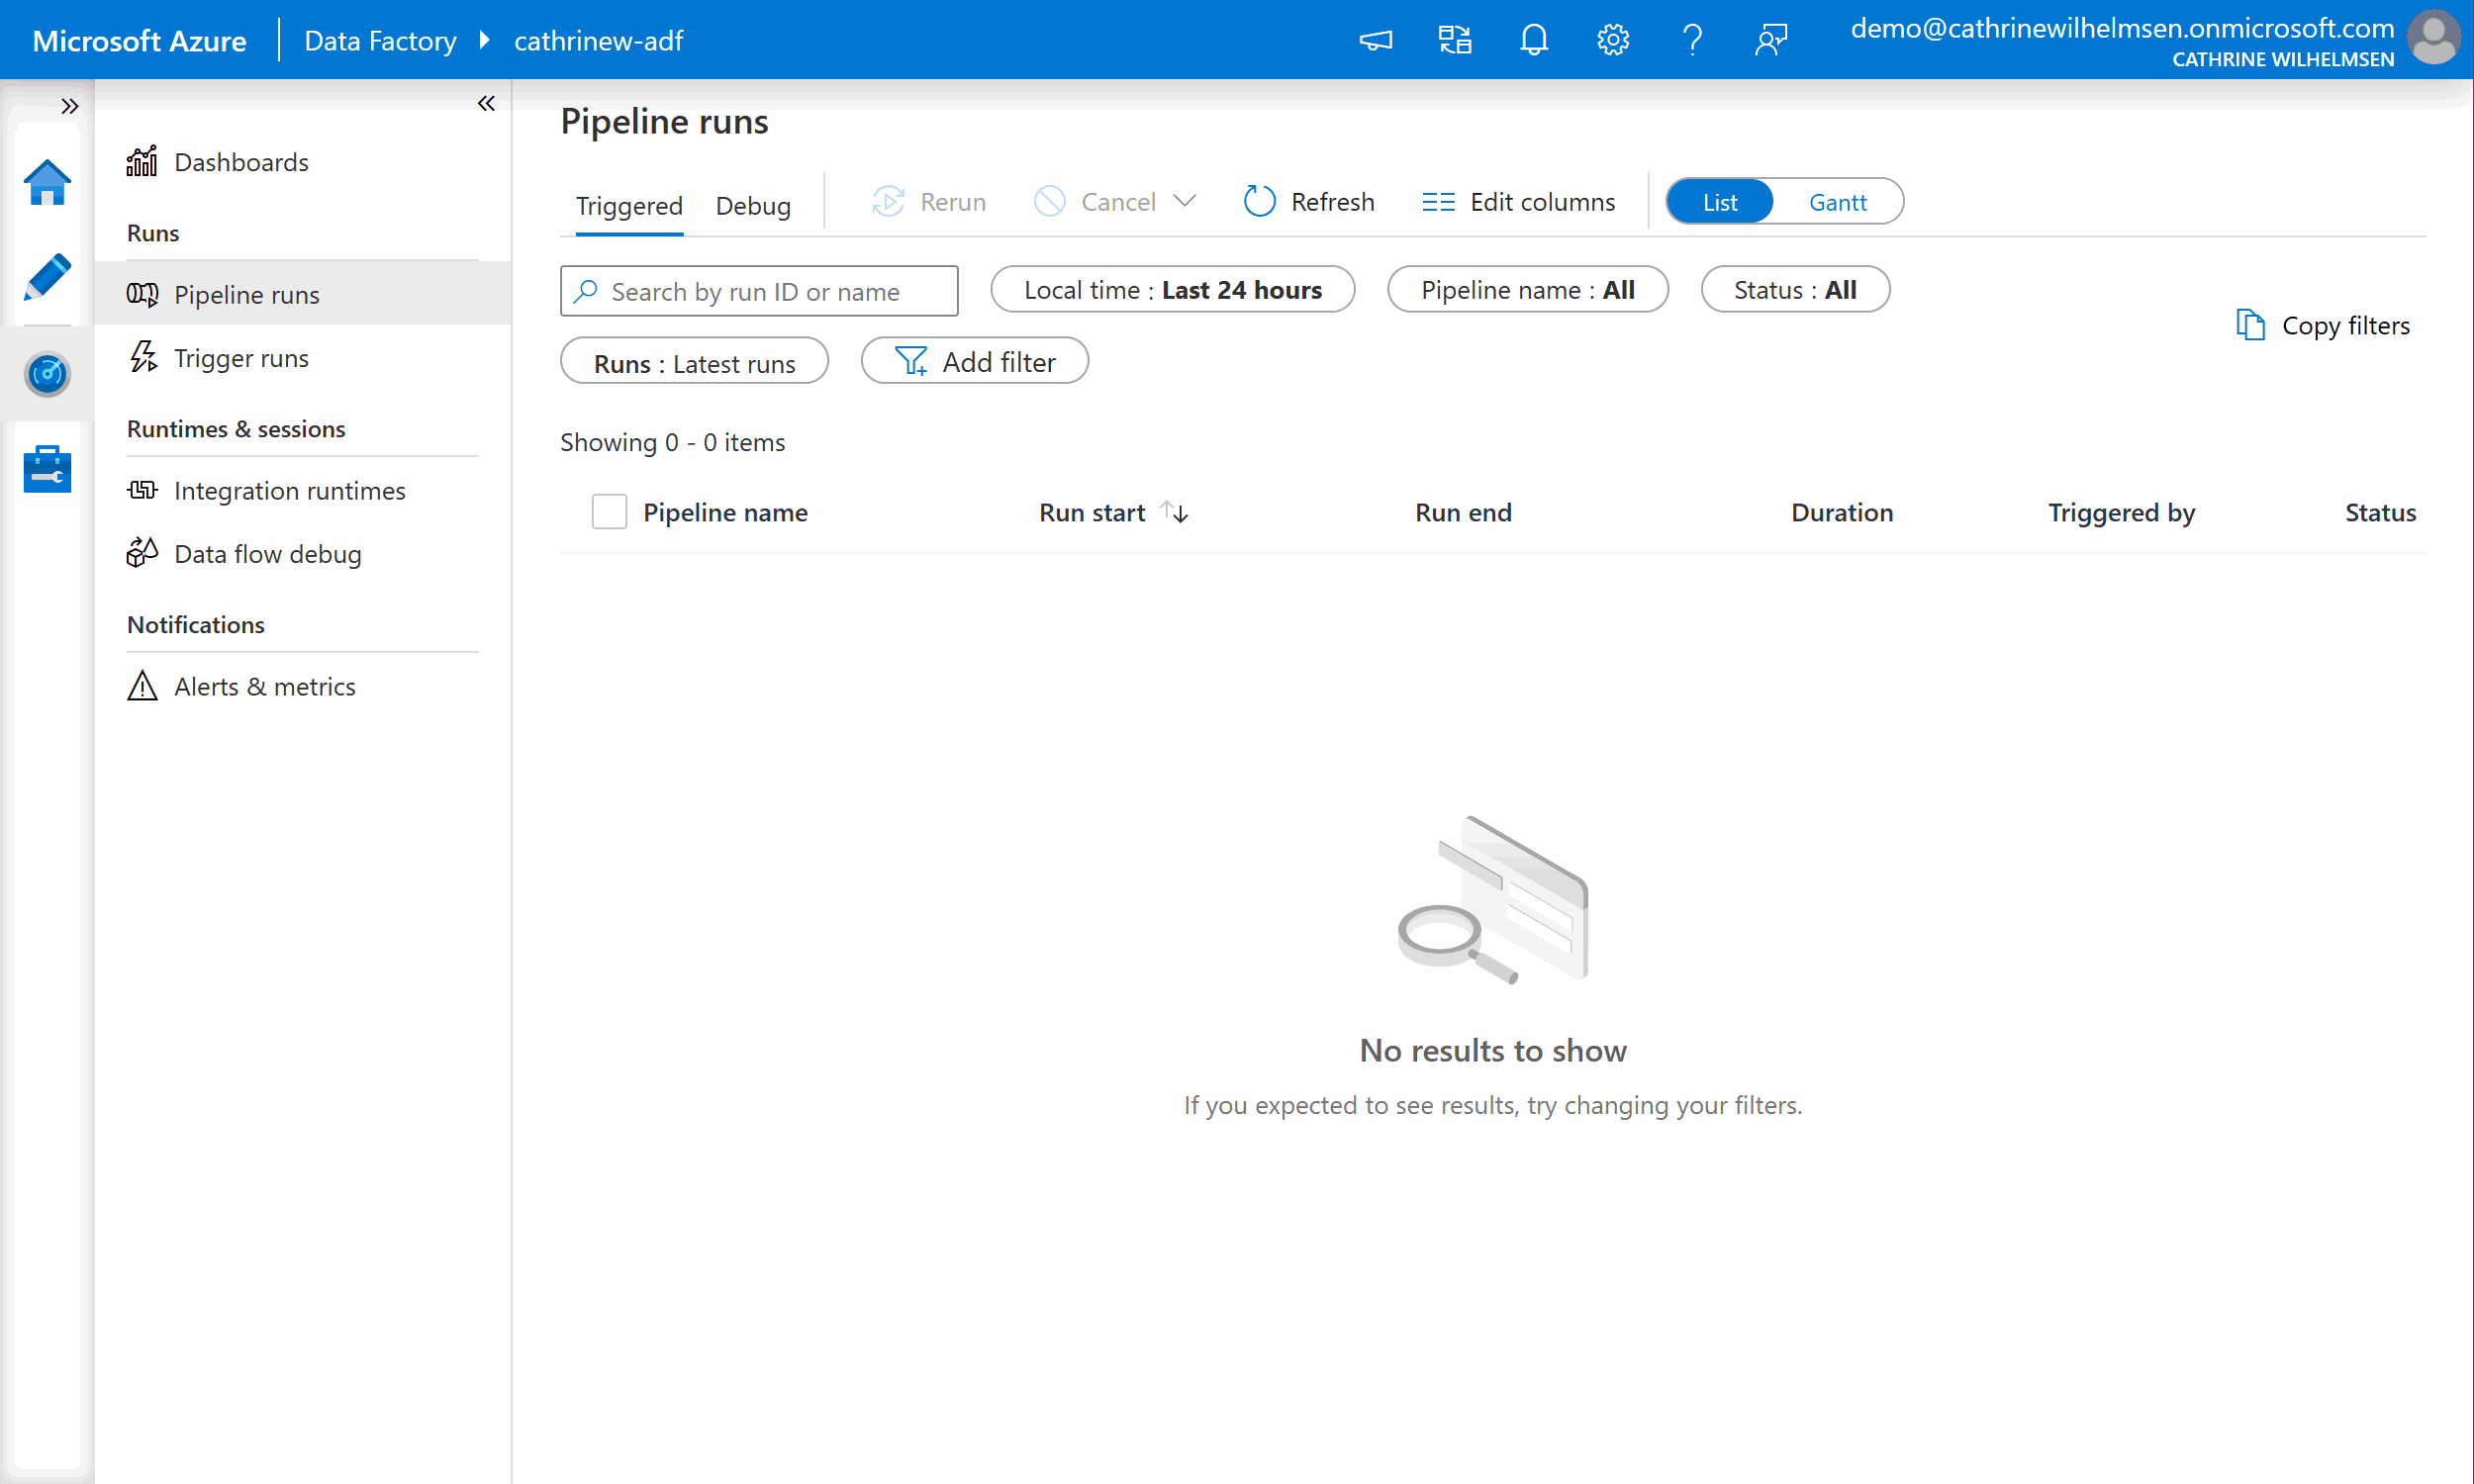
From here, you can view the overview dashboard, monitor your pipeline and trigger runs, view runtimes and sessions, and set up alerts.
Manage Page
The Manage page, or Management Hub, was added in March 2020:
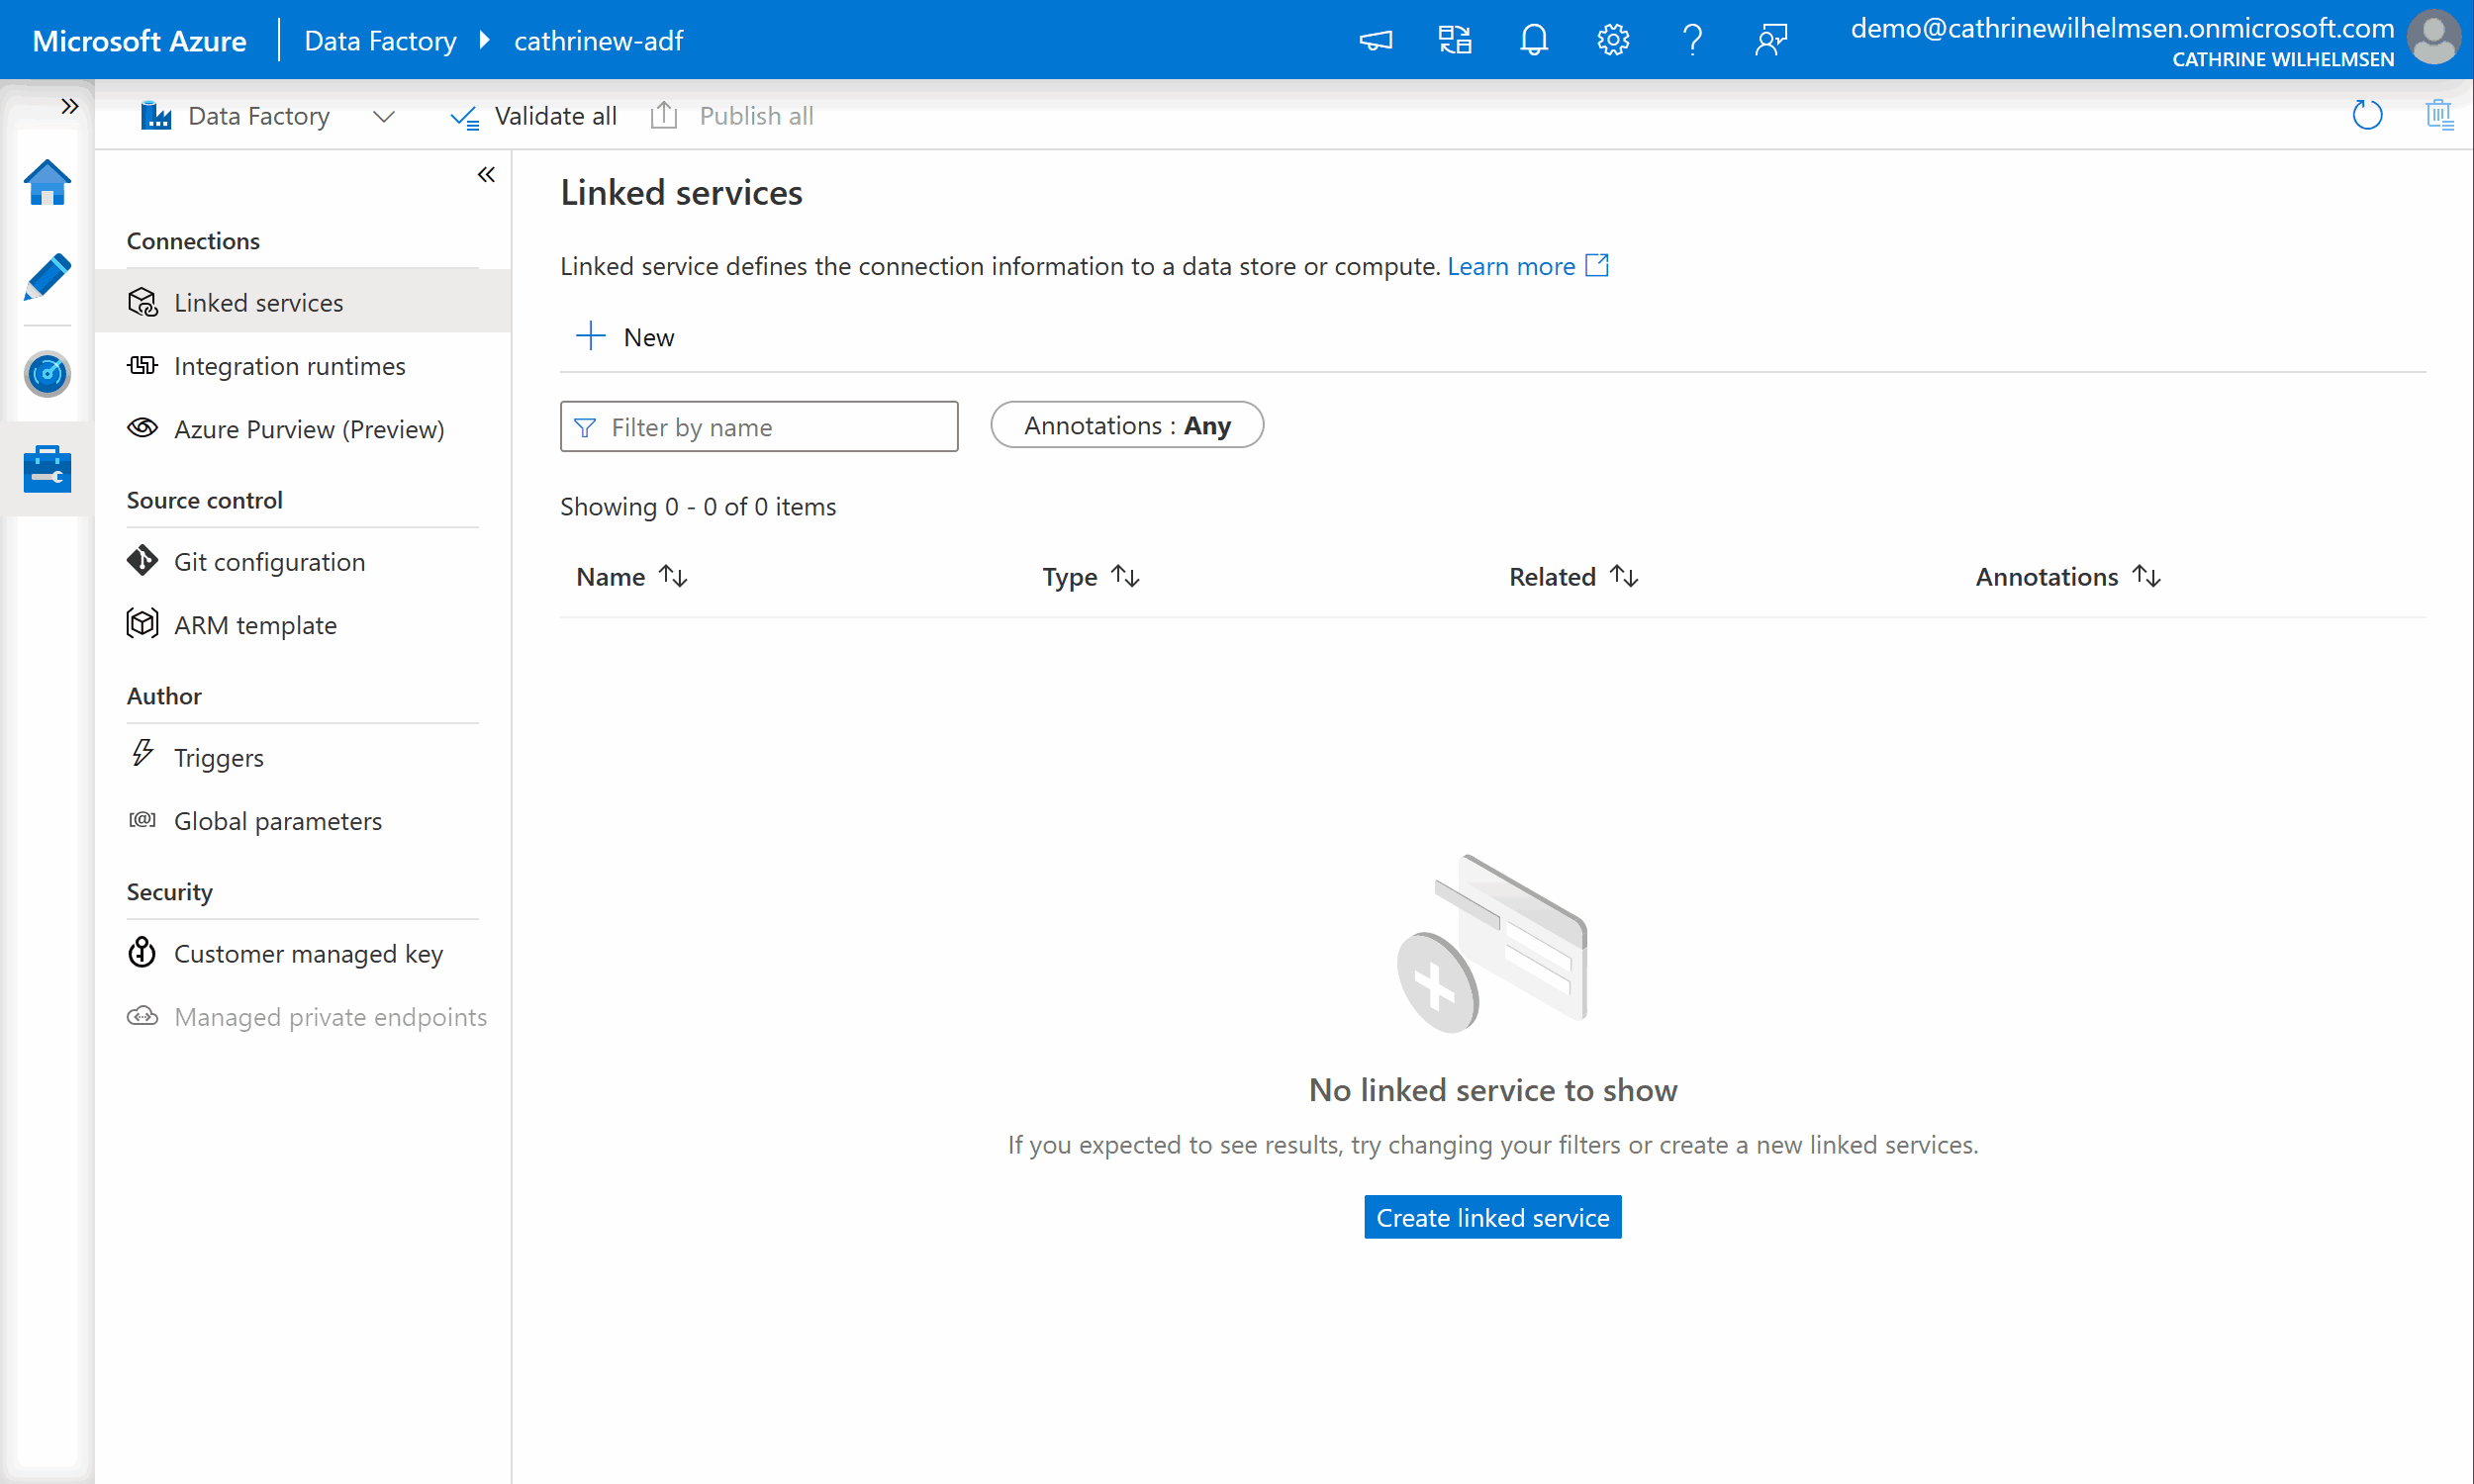
From here, you can manage connections, source control, triggers, parameters, and security.
(Oh, and… This page was added after I originally wrote this blog post series. That means that you might still see screenshots without this page, or I might be referencing things that have been moved into this page. I’m working on updating this! 😳😅)
Azure Data Factory Menu
On the top of the screen, you will see the Azure Data Factory menu. Click on the icons to open the different panes:

Updates Pane
Your go-to for news and updates is the Updates pane.
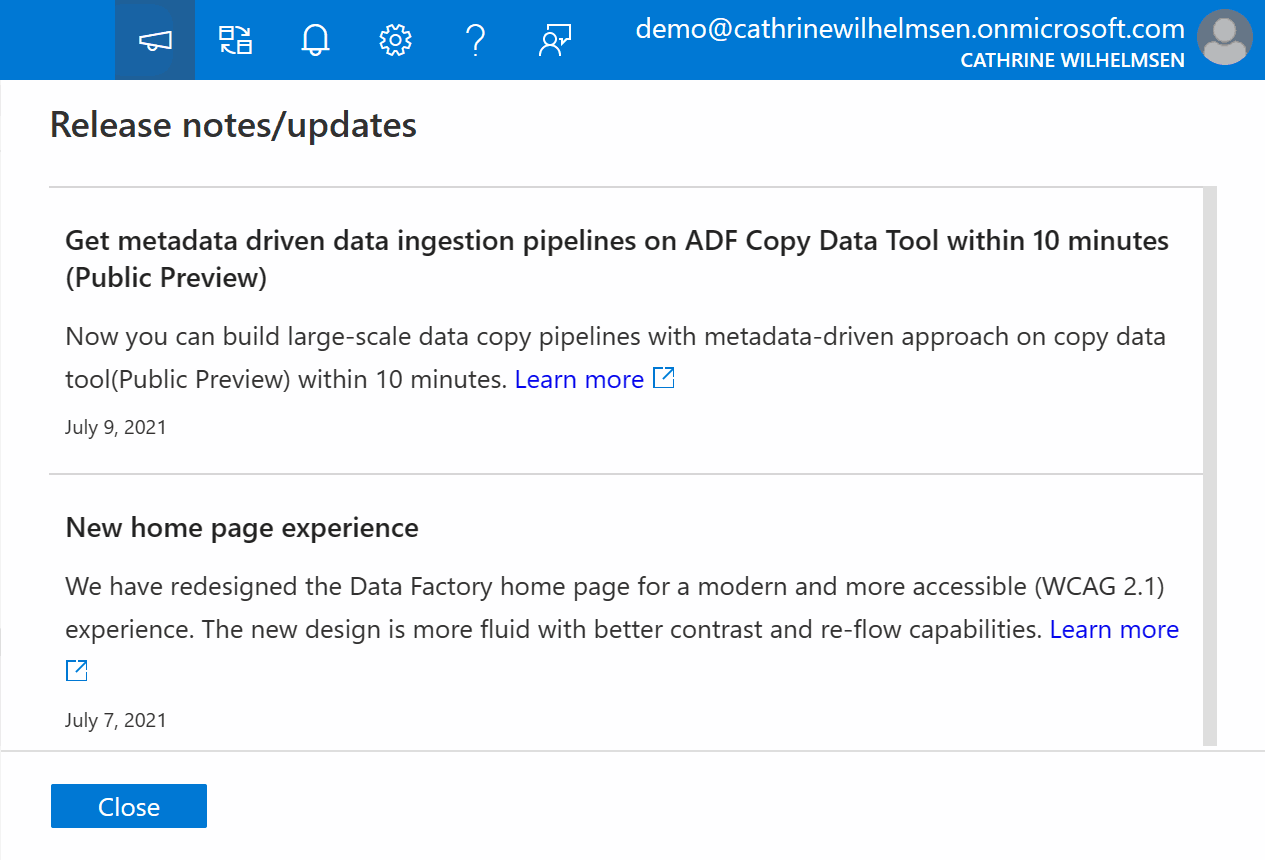
(Except for user interface changes. Those updates happen very frequently and isn’t always documented 😅)
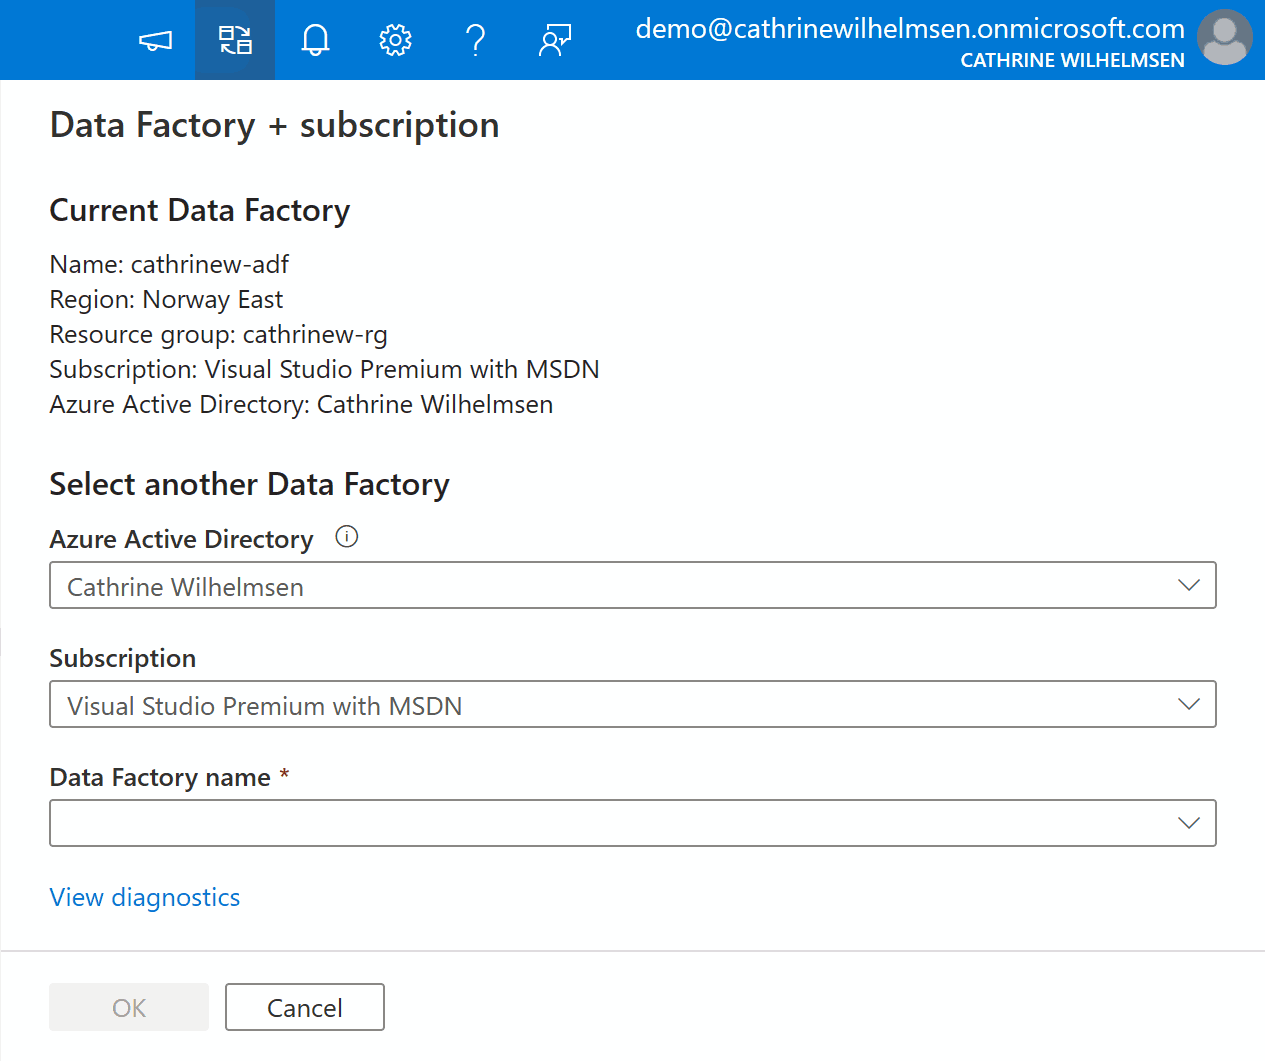
Switch Data Factory Pane
If you are working with multiple Azure Data Factories, you can easily switch between them in the Switch Data Factory pane:
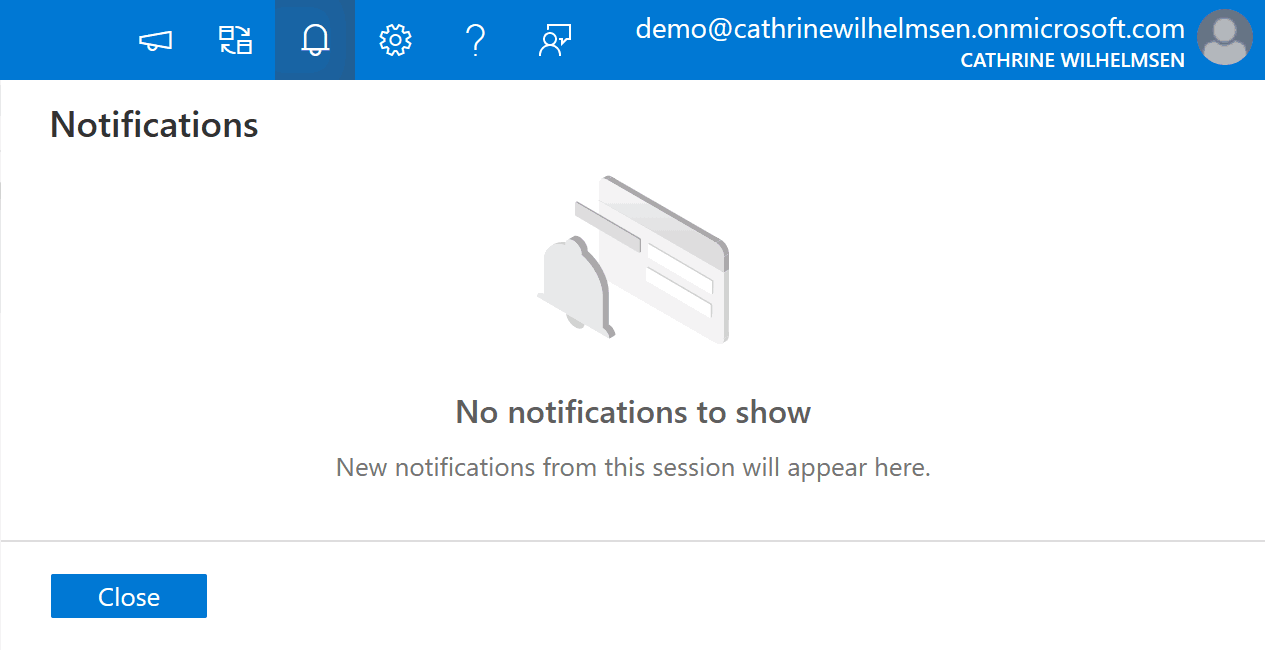
Notifications Pane
Once you start doing things in Azure Data Factory, you will see the Notifications pane start to light up:
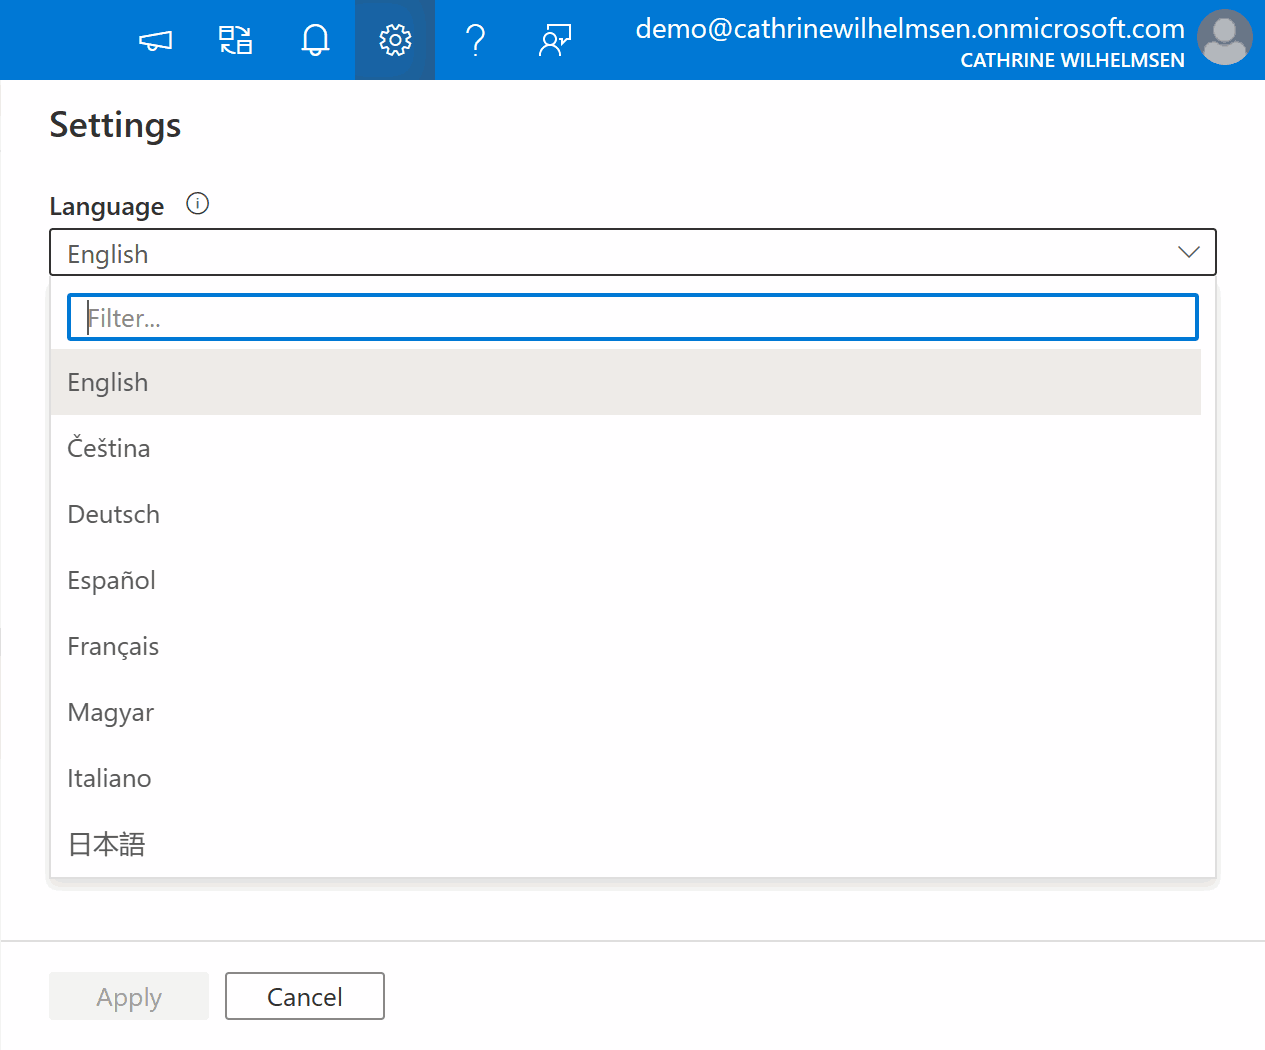
Settings Menu
From the Settings menu, you can change the language of the interface:
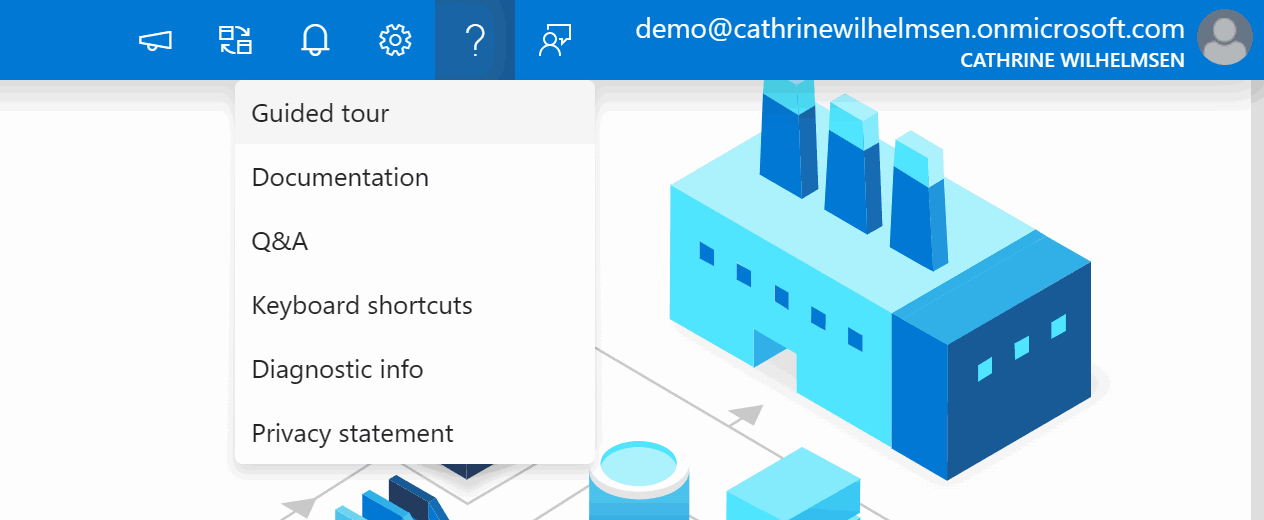
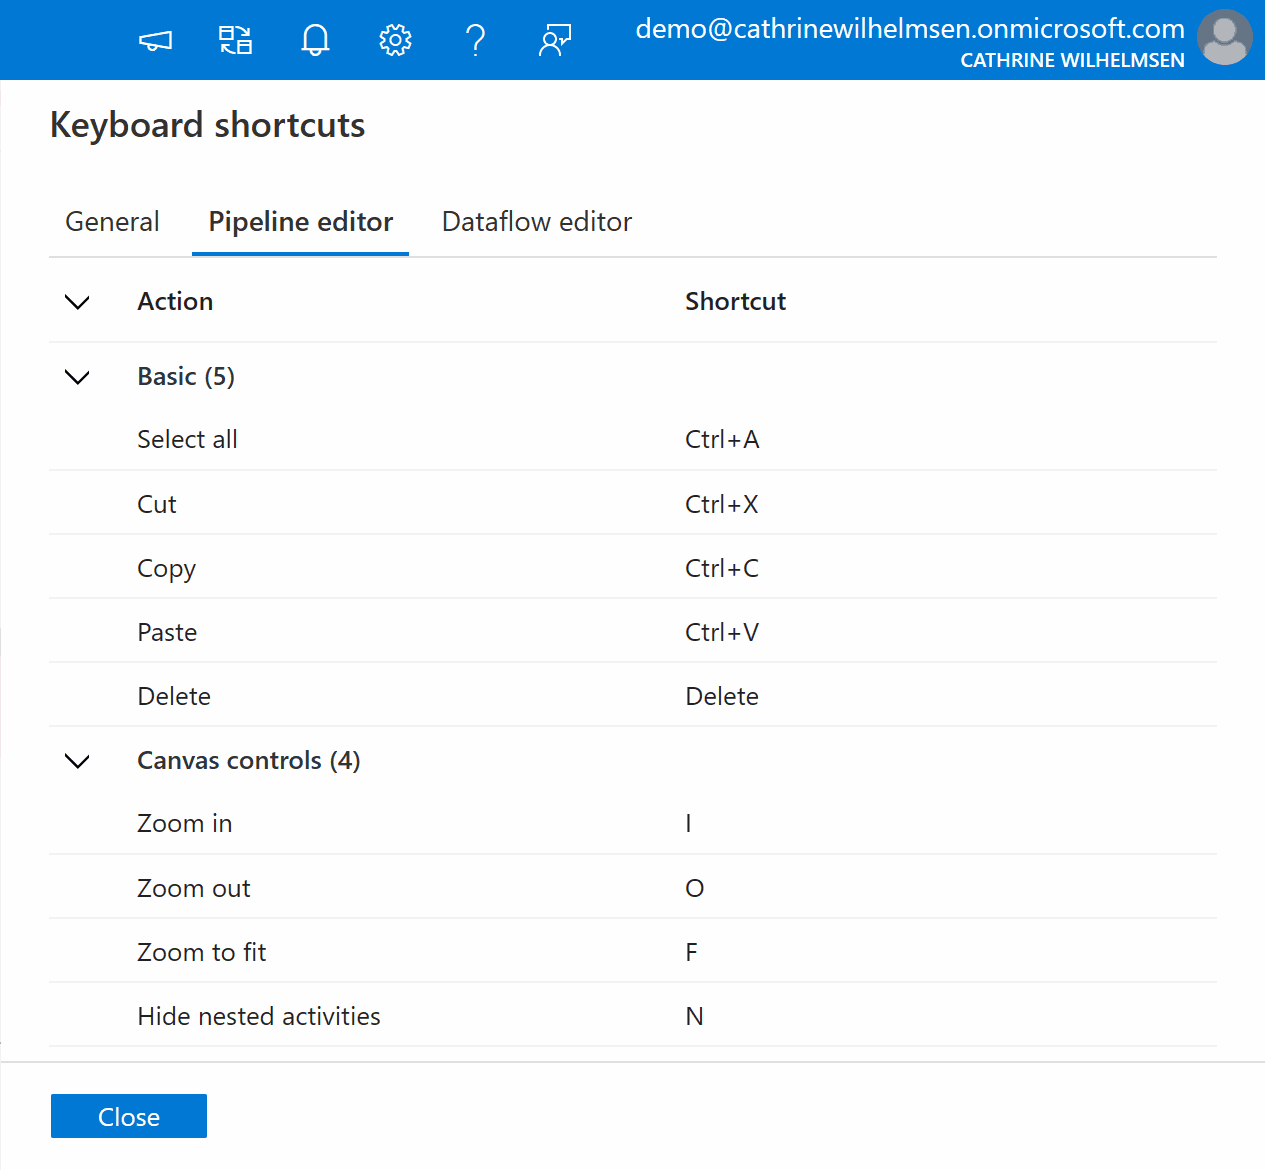
Help Menu
If you ever get stuck on something, click on the question mark to open the Help menu. From here, you can navigate to the Documentation and Q&A:
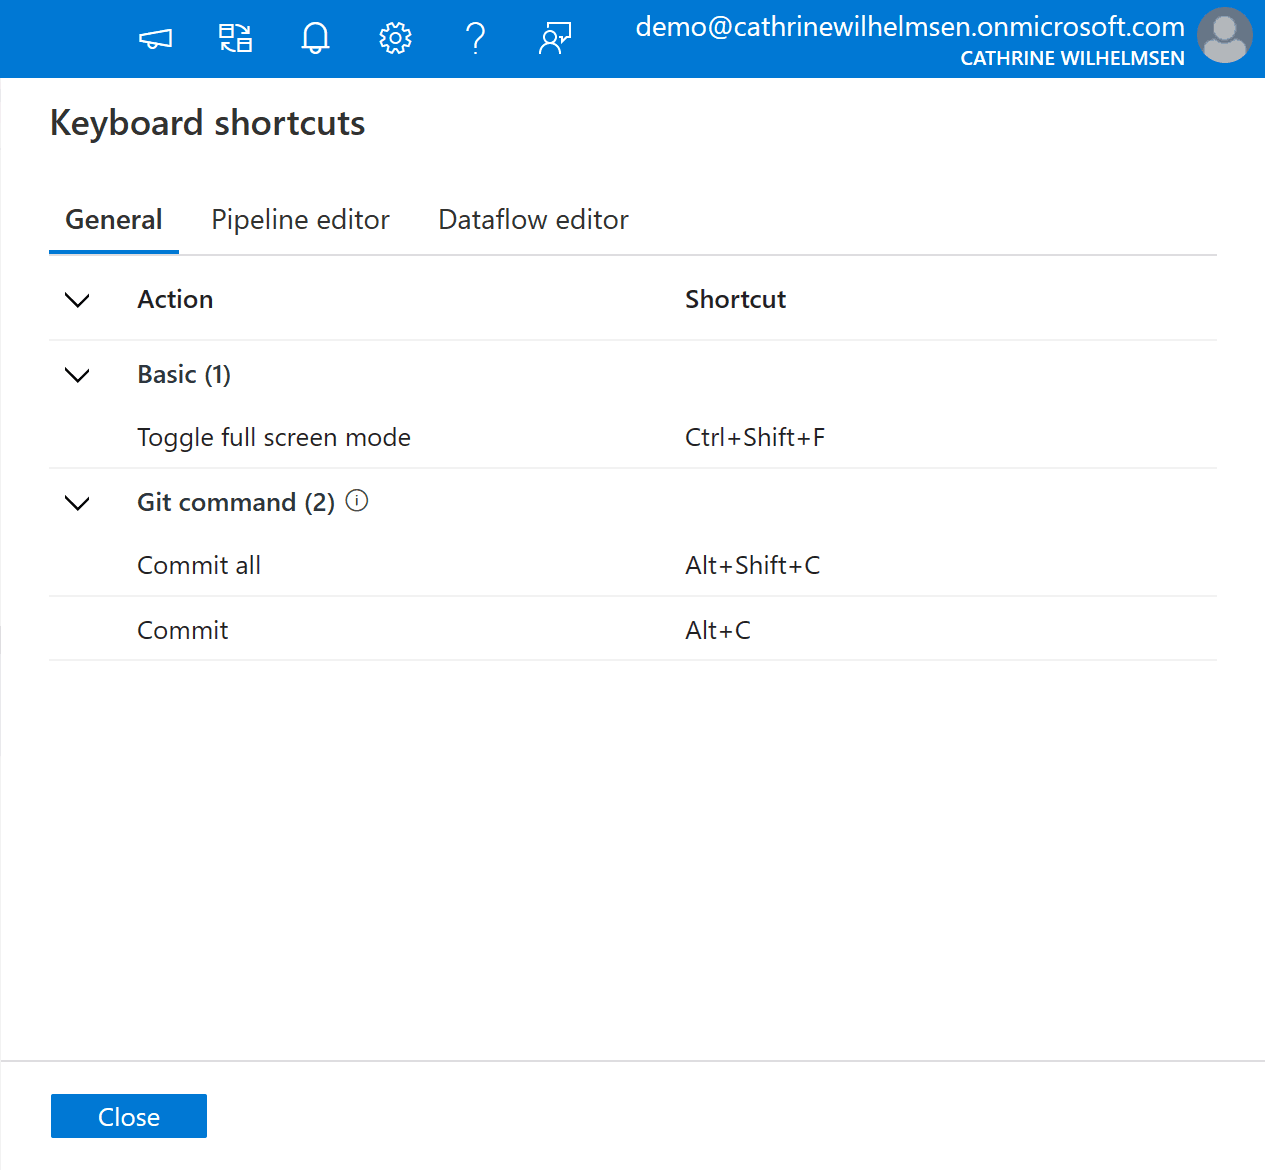
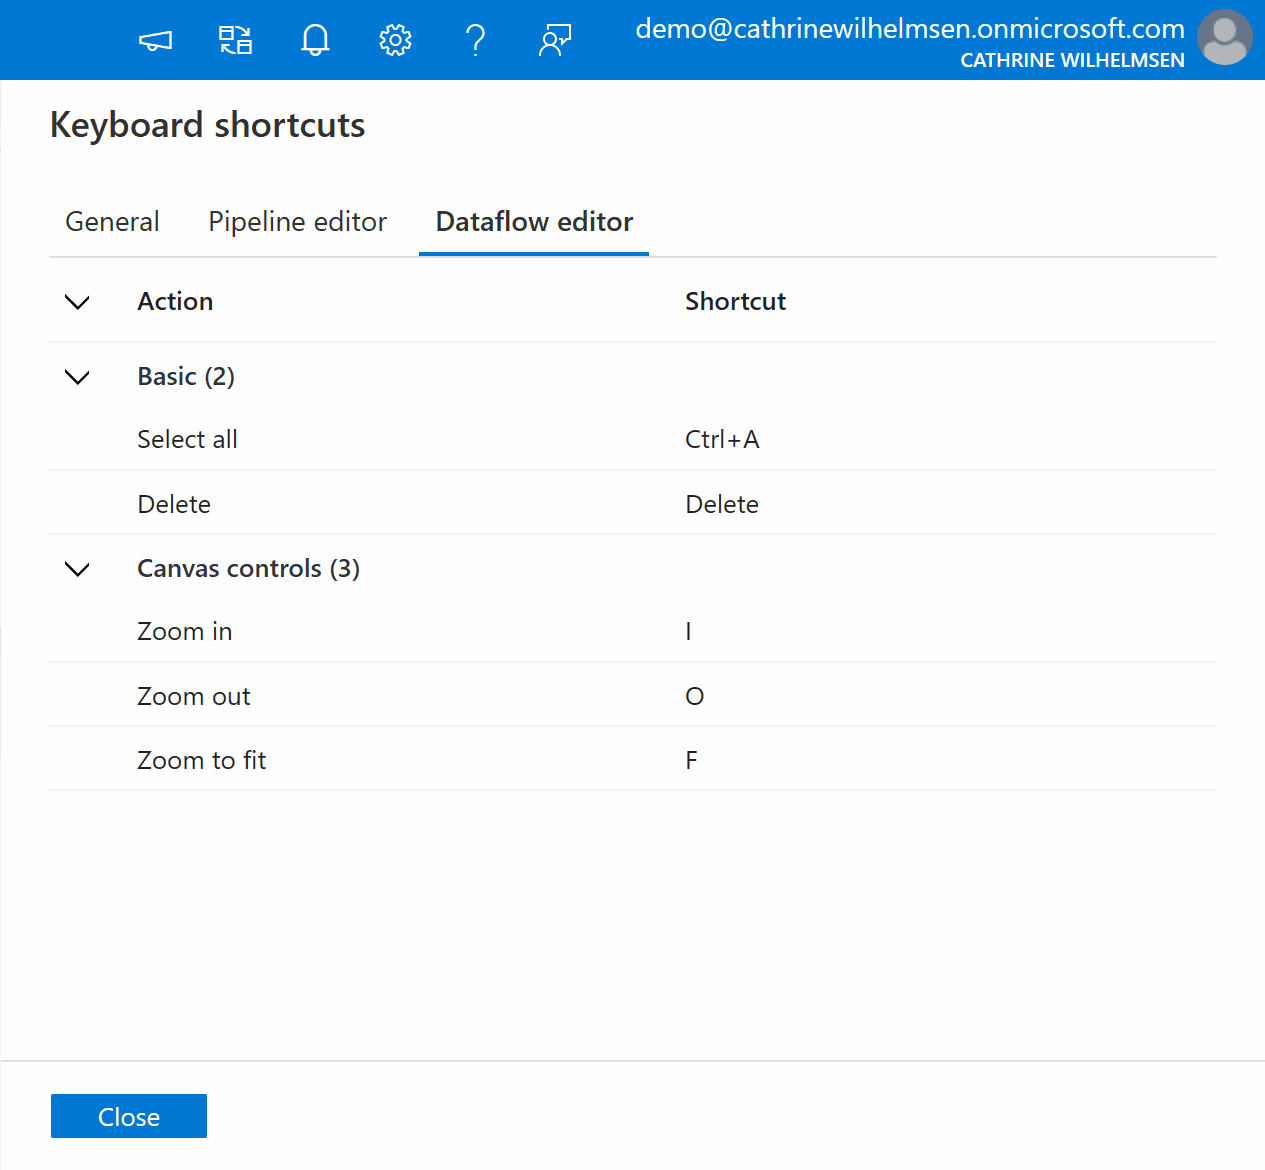
You can also view all the keyboard shortcuts:
Feedback Pane
If you notice something odd, or something you really like, use the Feedback pane. From here, you can also navigate to the Azure Feedback Forum for Azure Data Factory:
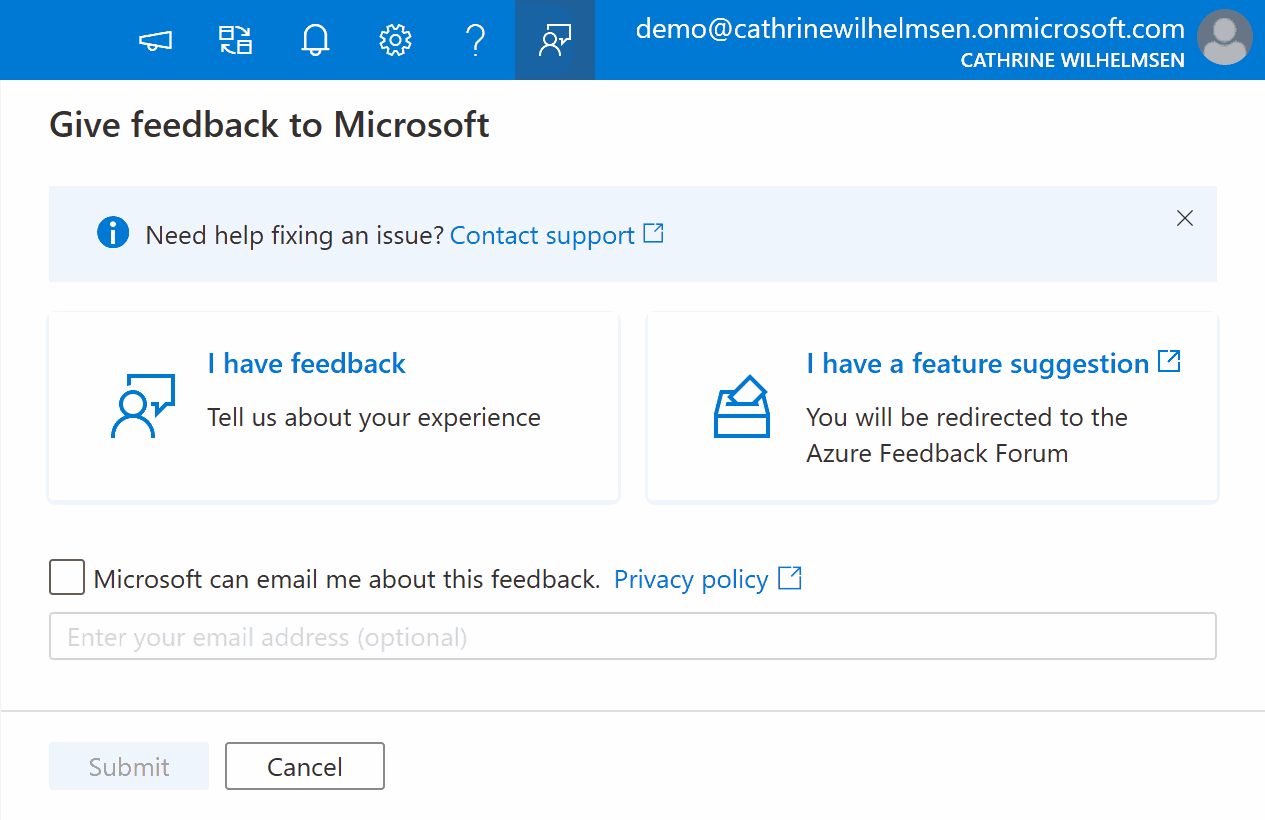
(The Azure Data Factory team are really good at following up as long as you provide your email address. I usually get a reply within a day or two, and I have seen several bugs fixed after reporting them through this form. So… use it as often as you can!)
Summary
In this post, we looked at the Azure Data Factory user interface and the four main Azure Data Factory pages.
In the next post, we will go through the Author page in more detail. Let’s look at the different Azure Data Factory components!
About the Author
 Cathrine Wilhelmsen is a Microsoft Data Platform MVP, international speaker, author, blogger, organizer, and chronic volunteer. She loves data and coding, as well as teaching and sharing knowledge - oh, and sci-fi, gaming, coffee and chocolate 🤓